Confidence intervals explained, with an R simulation

statistics
confidence-intervals
estimation
What a 95% confidence interval really means — demonstrated by simulating repeated samples in R — plus how to compute intervals for a mean and a proportion.
Author

Rverse Analytics

Published

June 12, 2026

A confidence interval says more than a p-value: it shows the range of plausible values and how precisely you’ve estimated them. But the “95%” is almost always misread. Let’s fix that with a simulation. (Just need an interval? Use our confidence interval calculator.)

What 95% actually means

A 95% CI is built by a procedure that, across many repeated samples, produces intervals capturing the true value 95% of the time. It is not a 95% probability that the truth lies in this particular interval — once computed, the interval either contains the true value or it doesn’t.

Watch it work

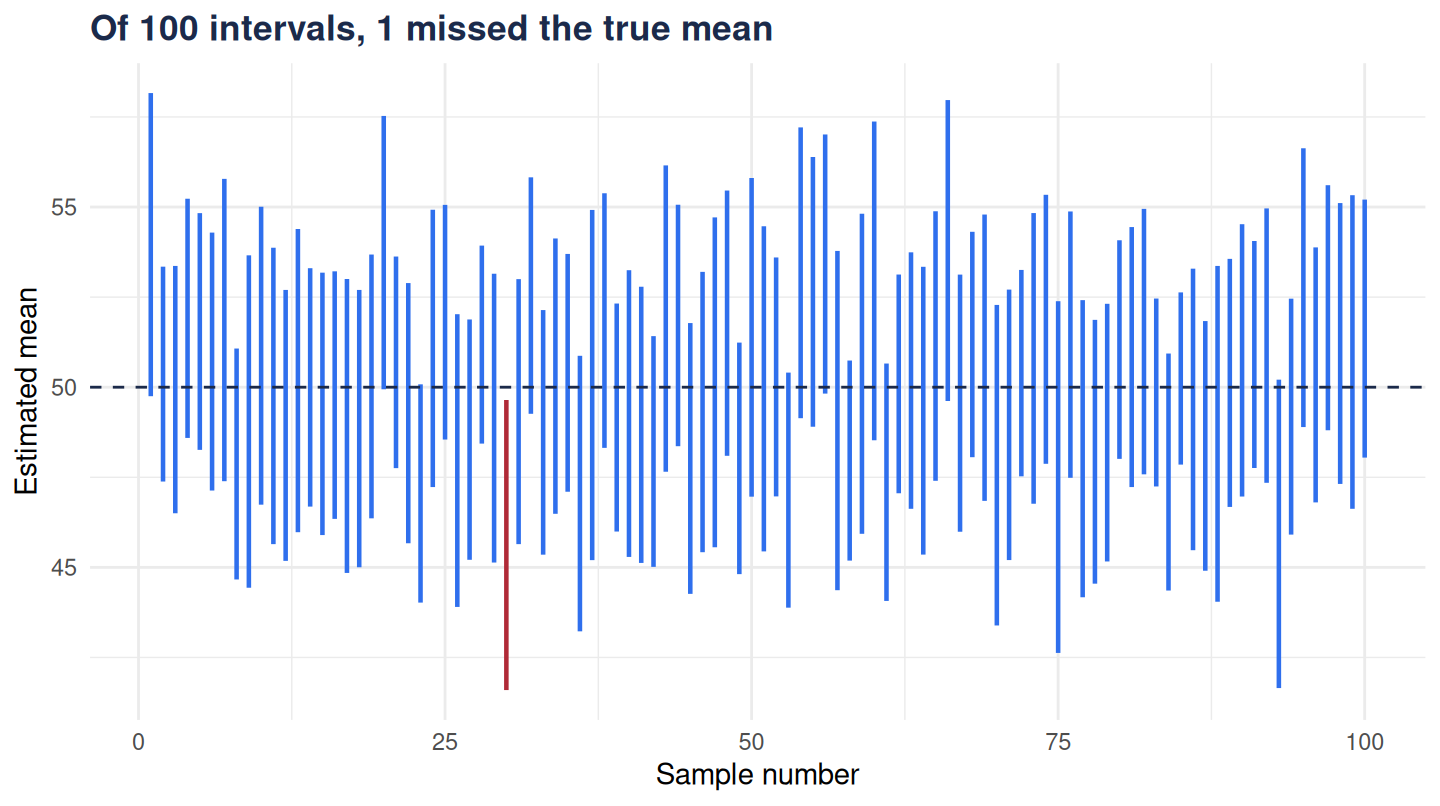
Draw 100 samples from a population with a known mean of 50, build a 95% CI from each, and colour the ones that miss:
library(ggplot2)
set.seed(7)
sims <- t(replicate(100, {
  x <- rnorm(30, mean = 50, sd = 10)
  as.numeric(t.test(x)$conf.int)
}))
d <- data.frame(study = 1:100, lo = sims[,1], hi = sims[,2])
d$miss <- d$lo > 50 | d$hi < 50

ggplot(d, aes(study, ymin = lo, ymax = hi, colour = miss)) +
  geom_linerange(linewidth = 0.8) +
  geom_hline(yintercept = 50, linetype = 2, colour = "#1b2a4a") +
  scale_colour_manual(values = c("FALSE" = "#2f6fed", "TRUE" = "#b02a37"),
                      guide = "none") +
  labs(title = paste0("Of 100 intervals, ", sum(d$miss), " missed the true mean"),
       x = "Sample number", y = "Estimated mean") +
  theme_minimal(base_family = "sans") +
  theme(plot.title = element_text(face = "bold", colour = "#1b2a4a"))
Figure 1

Close to 5 in 100 miss — that’s the 95% procedure behaving exactly as designed.

Computing them

x <- rnorm(30, 50, 10)
t.test(x)$conf.int          # mean, t-based
[1] 45.57248 54.44697
attr(,"conf.level")
[1] 0.95
prop.test(40, 50)$conf.int  # proportion (Wilson-style)
[1] 0.6585632 0.8949784
attr(,"conf.level")
[1] 0.95

For proportions, prefer the Wilson interval over the textbook Wald formula — it behaves far better for small samples and extreme proportions.

Why report them

A CI answers “how big, and how sure?” in one line — far more useful than a bare p-value. Wide interval, more uncertainty; narrow, more precision.


Intervals are only as good as their assumptions. Checking those is our job.