Cross-references in Quarto: figures, tables and sections
quarto
reporting
How to number and cross-reference figures, tables, equations and sections in Quarto with @fig-, @tbl- and @sec- labels, so your report’s numbering is always correct.
In any real report you point at your outputs — “as Figure 1 shows”. Numbering them by hand is fragile: insert one figure and every later reference is off by one. Quarto numbers and links everything automatically, so the references are always right.
Label the figure, then reference it
Two halves. First, give a plotting chunk a label that starts with fig- and a fig-cap:
```{r}
#| label: fig-trend
#| fig-cap: "Weekly cumulative value over the study period."
plot(cumsum(rnorm(20)), type = "l")
```
Then, anywhere in your prose, write @fig-trend. Quarto turns it into the correct number and a clickable link.
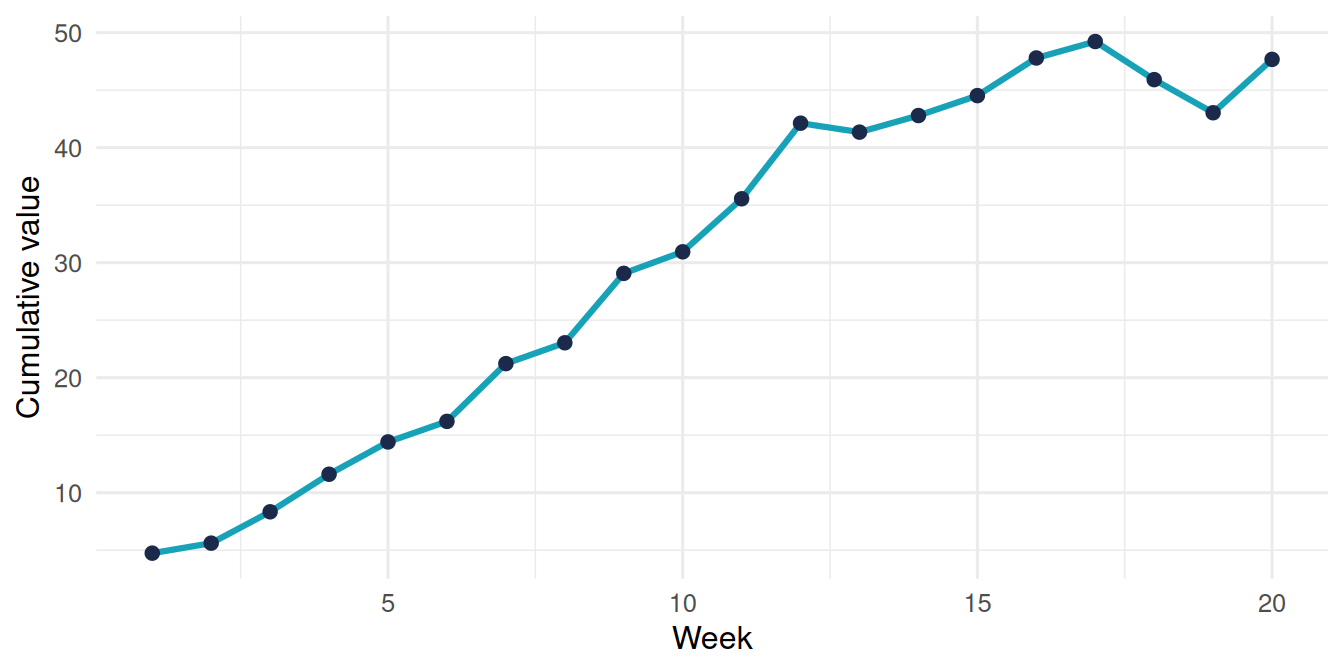
Here it is for real. The chunk below is labelled fig-cadence, and the sentence after it references @fig-cadence — notice the number and link appear automatically:
The trend in Figure 1 rises steadily — and that reference is a live cross-reference, not a number we typed.
The same pattern for everything
Change the prefix and Quarto cross-references other elements too:
| Prefix | Element | Reference with |
|---|---|---|
fig- |
figures | @fig-name |
tbl- |
tables | @tbl-name |
eq- |
equations | @eq-name |
sec- |
sections | @sec-name |
For a table, label the chunk (or Markdown table) with tbl- and a tbl-cap, then reference it with @tbl-name. For sections, add {#sec-methods} after a heading and reference @sec-methods — but you must also switch on number-sections: true in the YAML for section references to work.
The rule to remember
Define with a prefixed label; reference with an @ in front. Get the prefix right (fig-, tbl-, eq-, sec-) and Quarto does all the counting and linking — insert, delete or reorder freely and every number stays correct.
Work through it interactively in the figures & cross-references lesson.
Building a report where the numbering has to be perfect every time? That’s exactly what we do.