What a p-value is, what it isn’t, and a simulation in R that shows why p-values are uniform under the null hypothesis — the intuition most explanations skip.
Author
Rverse Analytics
Published
June 10, 2026
Few numbers are as widely reported and as widely misunderstood as the p-value. Here’s the correct definition, the common traps, and a short R simulation that makes the idea click. (Have a test statistic already? Convert it with our p-value calculator.)
The definition
The p-value is the probability of observing data at least as extreme as yours, assuming the null hypothesis is true.
Small p → your data would be surprising if there were no effect → evidence against the null. That’s it. It is not the probability that the null is true, and it says nothing about how big or important an effect is.
The simulation that makes it click
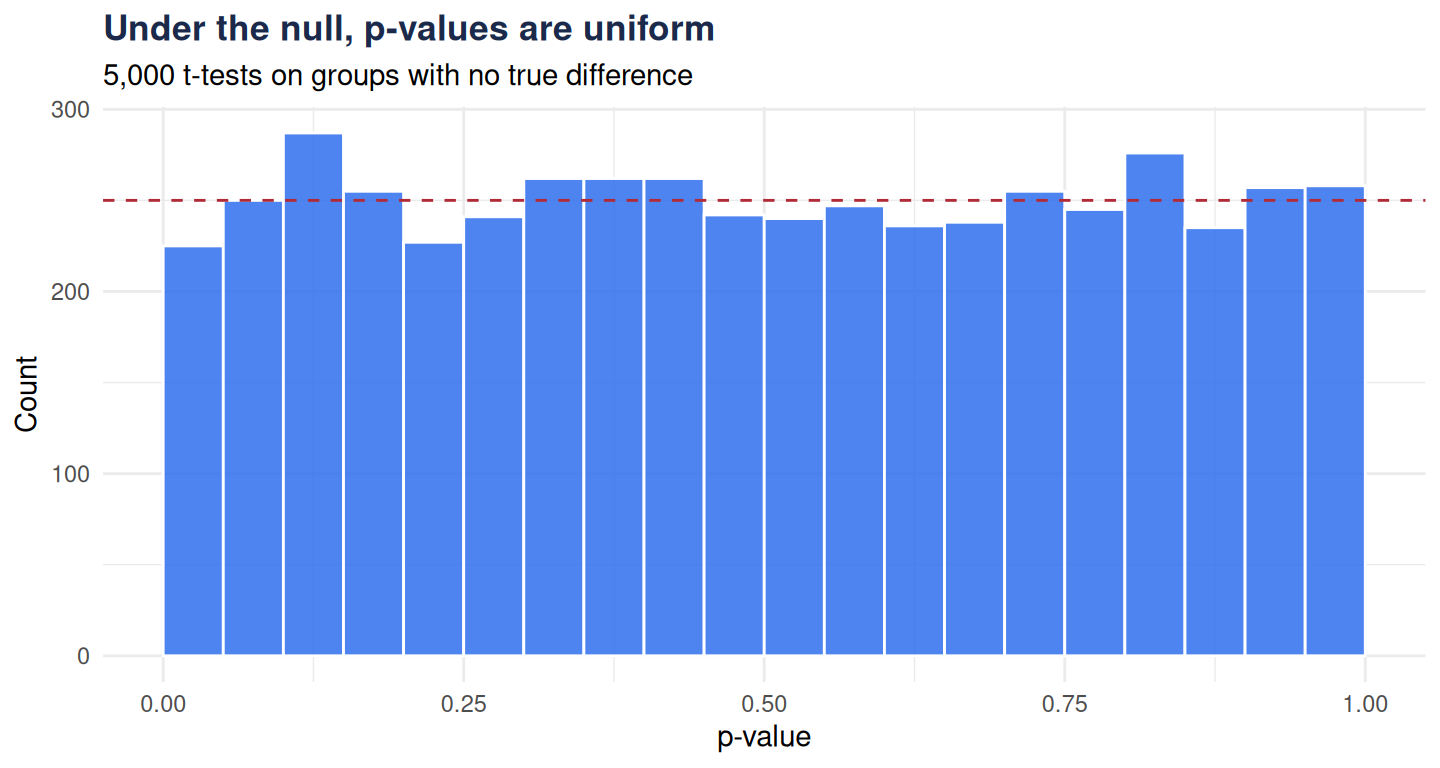
If the null hypothesis is true, p-values are uniformly distributed between 0 and 1. Let’s see it — run 5,000 t-tests on data with no real difference:
library(ggplot2)set.seed(1)pvals <-replicate(5000, t.test(rnorm(25), rnorm(25))$p.value)ggplot(data.frame(pvals), aes(pvals)) +geom_histogram(breaks =seq(0, 1, 0.05), fill ="#2f6fed",colour ="white", alpha =0.85) +geom_hline(yintercept =5000/20, linetype =2, colour ="#b02a37") +labs(title ="Under the null, p-values are uniform",subtitle ="5,000 t-tests on groups with no true difference",x ="p-value", y ="Count") +theme_minimal(base_family ="sans") +theme(plot.title =element_text(face ="bold", colour ="#1b2a4a"))
Figure 1
The bars are flat — every p-value is equally likely. And notice the leftmost bar: about 5% of tests give p < 0.05 even though nothing is going on. That 5% is your false-positive rate, and it’s exactly why running many tests and keeping the “significant” ones is so dangerous.
Three traps to avoid
p is not effect size. With a big enough sample, a trivial difference becomes “significant.” Always report an effect size and a confidence interval.
Non-significant ≠ no effect. It may just mean too little power.
p-hacking is real. Deciding tests after seeing the data inflates false positives — pre-specify.
A p-value is one line in a larger story. Want the whole analysis done right? We can help.