t_stat <- 1.9; df <- 25

2 * (1 - pt(abs(t_stat), df))   # two-tailed
[1] 0.069026631 - pt(t_stat, df) # one-tailed (right)[1] 0.03451331Should your test look for a difference in either direction, or just one? The answer changes your p-value — and getting it wrong is a classic way to fool yourself. (Converting a statistic? Use our p-value calculator.)
t_stat <- 1.9; df <- 25
2 * (1 - pt(abs(t_stat), df)) # two-tailed[1] 0.069026631 - pt(t_stat, df) # one-tailed (right)[1] 0.03451331The one-tailed p is exactly half the two-tailed p here. That’s the temptation — and the trap.
library(ggplot2)
x <- seq(-4, 4, length.out = 400); d <- data.frame(x, y = dnorm(x))
crit <- qnorm(0.975)
ggplot(d, aes(x, y)) +
  geom_area(data = subset(d, x >= crit), fill = "#b02a37", alpha = 0.5) +
  geom_area(data = subset(d, x <= -crit), fill = "#b02a37", alpha = 0.5) +
  geom_line(colour = "#1b2a4a", linewidth = 1) +
  labs(title = "Two-tailed test: 2.5% rejection region in EACH tail",
       x = "Test statistic", y = "Density") +
  theme_minimal(base_family = "sans") +
  theme(plot.title = element_text(face = "bold", colour = "#1b2a4a"))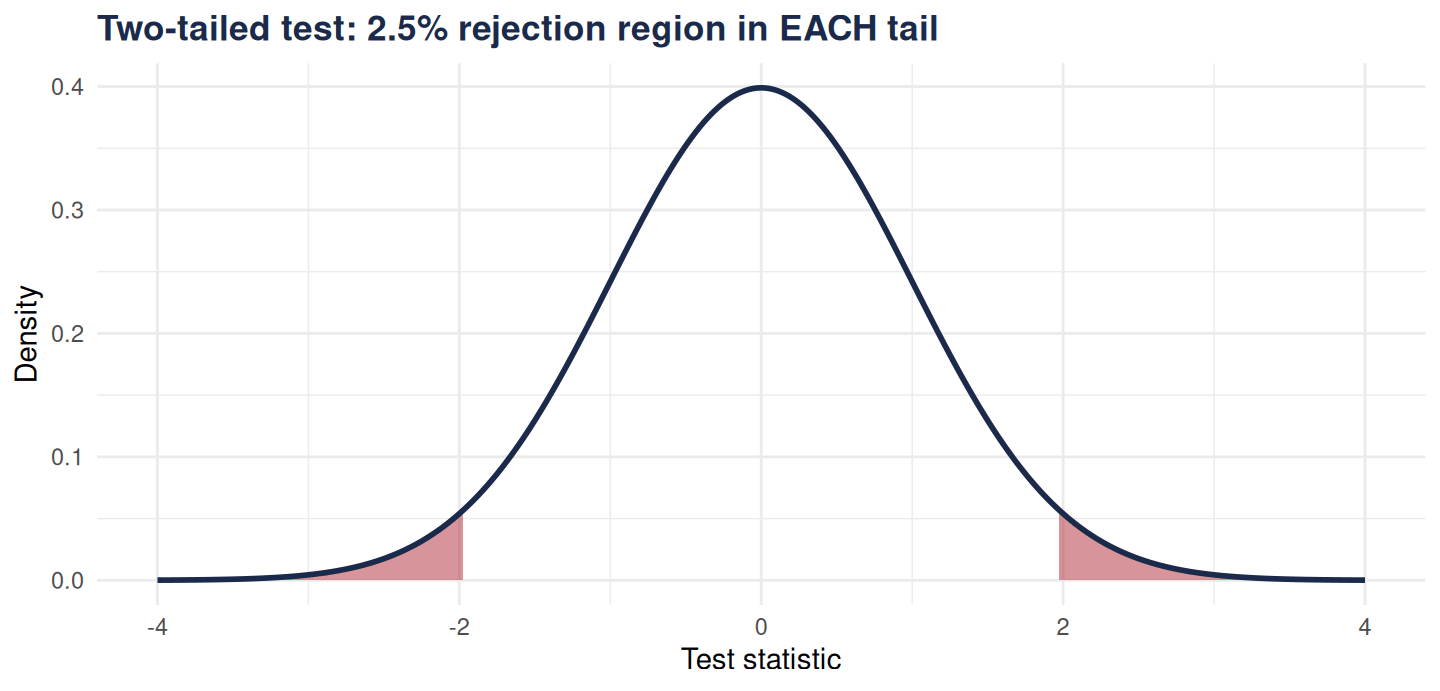
If you decide the direction after seeing which way the data went, you’ve effectively used both tails while paying for one — inflating your false-positive rate above the 5% you claim.
Use two-tailed unless you have a strong, pre-registered reason to test a single direction (and you’d genuinely ignore an effect the other way). In R, t.test() takes alternative = "greater" or "less" for one-tailed tests — set it based on your hypothesis, not your results.
Pre-specifying analyses is part of doing statistics honestly. That’s how we work.