monthly <- readr::read_csv("data/measurements.csv") |>
dplyr::filter(site == params$site,
format(date, "%Y-%m") == params$month)One template, fifty reports: parameterised Quarto in practice
quarto
reporting
workflow
How we turn a single Quarto document into a batch of per-site or per-client reports with one line of R.
A pattern that pays for itself on almost every reporting project: write one Quarto document, declare its inputs as parameters, and render it once per site, clinic, region or client.
Declare the parameters
In the report’s YAML header:
---
title: "Monthly Quality Report — `r params$site`"
format: docx
params:
  site: "Site A"
  month: "2026-06"
---
Inside the document, params$site and params$month drive the filtering:
Render the batch
One small driver script produces the whole set:
sites <- c("Site A", "Site B", "Site C")

for (s in sites) {
  quarto::quarto_render(
    "monthly_report.qmd",
    execute_params = list(site = s, month = "2026-06"),
    output_file = paste0("report_", gsub(" ", "_", s), "_2026-06.docx")
  )
}
Fifty sites is the same loop with a longer vector.
Why this beats copy-paste
library(ggplot2)

d <- data.frame(
  n_reports = rep(1:50, 2),
  approach  = rep(c("Manual copy-paste", "Parameterised Quarto"), each = 50)
)
d$hours <- ifelse(d$approach == "Manual copy-paste",
                  d$n_reports * 1.5,          # ~1.5 h per hand-edited report
                  6 + d$n_reports * 0.02)     # one-time template + render time

ggplot(d, aes(n_reports, hours, colour = approach)) +
  geom_line(linewidth = 1.2) +
  scale_colour_manual(values = c("#1b2a4a", "#17a2b8")) +
  labs(
    title = "Cumulative effort: hand-edited vs. parameterised reports",
    subtitle = "Illustrative estimates — the template costs more up front, then almost nothing",
    x = "Number of reports", y = "Hours of analyst time", colour = NULL
  ) +
  theme_minimal() +
  theme(legend.position = "bottom",
        plot.title = element_text(face = "bold", colour = "#1b2a4a"))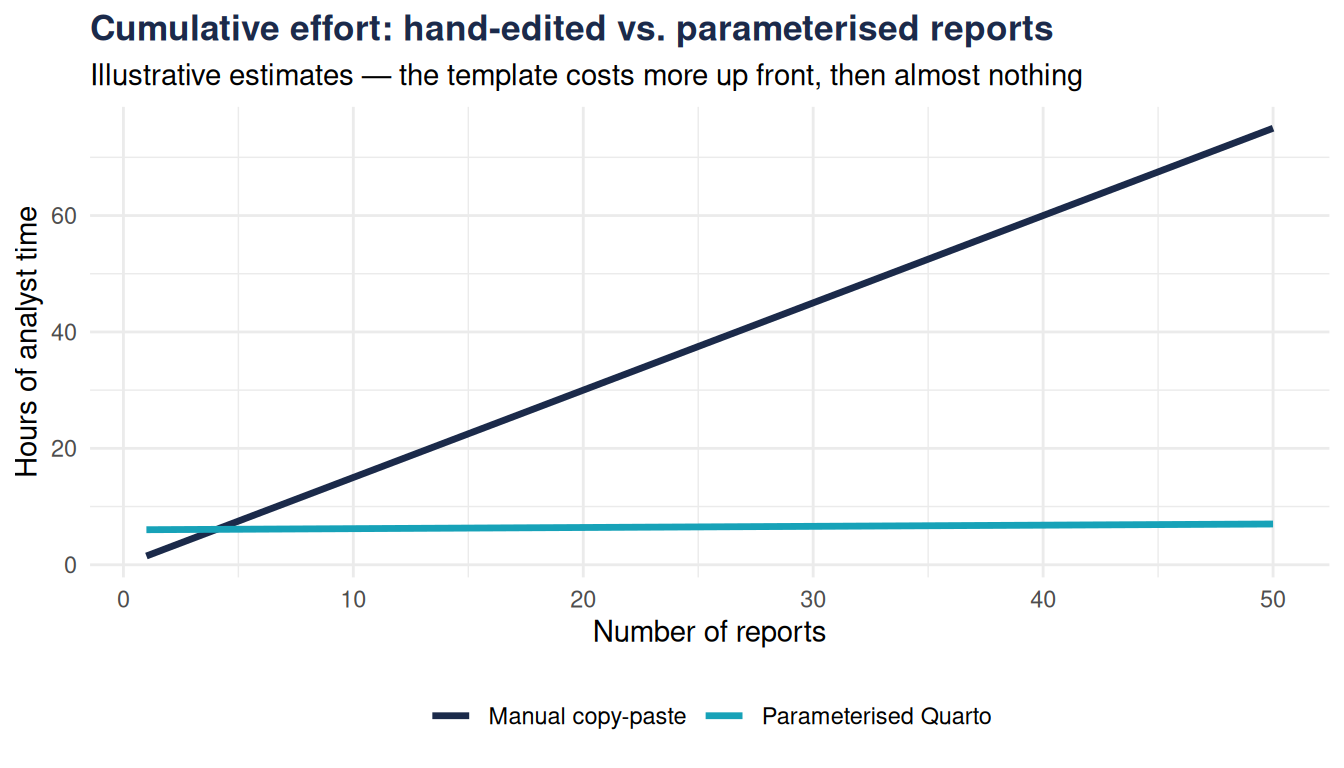
Beyond the hours, the real win is consistency: every report is generated from the same logic, so a fix or improvement lands in all fifty at the next render — and none of them can silently drift out of sync with the data.