set.seed(13)
n <- 300
x <- rnorm(n)
prob <- plogis(-0.4 + 1.3 * x)         # true relationship
y <- rbinom(n, 1, prob)                # binary outcome
fit <- glm(y ~ x, family = binomial) # predicted probabilitiesROC curve and AUC in R
clinical
biostatistics
r-tutorial
How to draw a ROC curve and compute the AUC in R with the pROC package — measuring how well a model or test discriminates between two outcomes, with a confidence interval.
When a model or test produces a score and you want to know how well it separates two groups — disease vs no disease, responder vs non-responder — the ROC curve and its AUC are the standard summary. Here’s the R. (Working from a fixed 2×2 table instead? Use our diagnostic test calculator.)
Fit a model that produces scores
The ROC curve and AUC
The ROC curve plots sensitivity against 1 − specificity across every possible threshold; the area under it (AUC) summarises discrimination in one number — 0.5 is a coin flip, 1.0 is perfect separation.
library(pROC)
roc_obj <- roc(y, fitted(fit), quiet = TRUE)

auc(roc_obj)
Area under the curve: 0.778ci.auc(roc_obj) # confidence interval for the AUC95% CI: 0.725-0.8309 (DeLong)plot(roc_obj, col = "#2f6fed", lwd = 3, legacy.axes = TRUE,
xlab = "1 - Specificity", ylab = "Sensitivity", main = "ROC curve")
abline(0, 1, lty = 2, col = "#8a93a6")
text(0.6, 0.2, sprintf("AUC = %.3f", as.numeric(auc(roc_obj))),
col = "#1b2a4a", font = 2, cex = 1.2)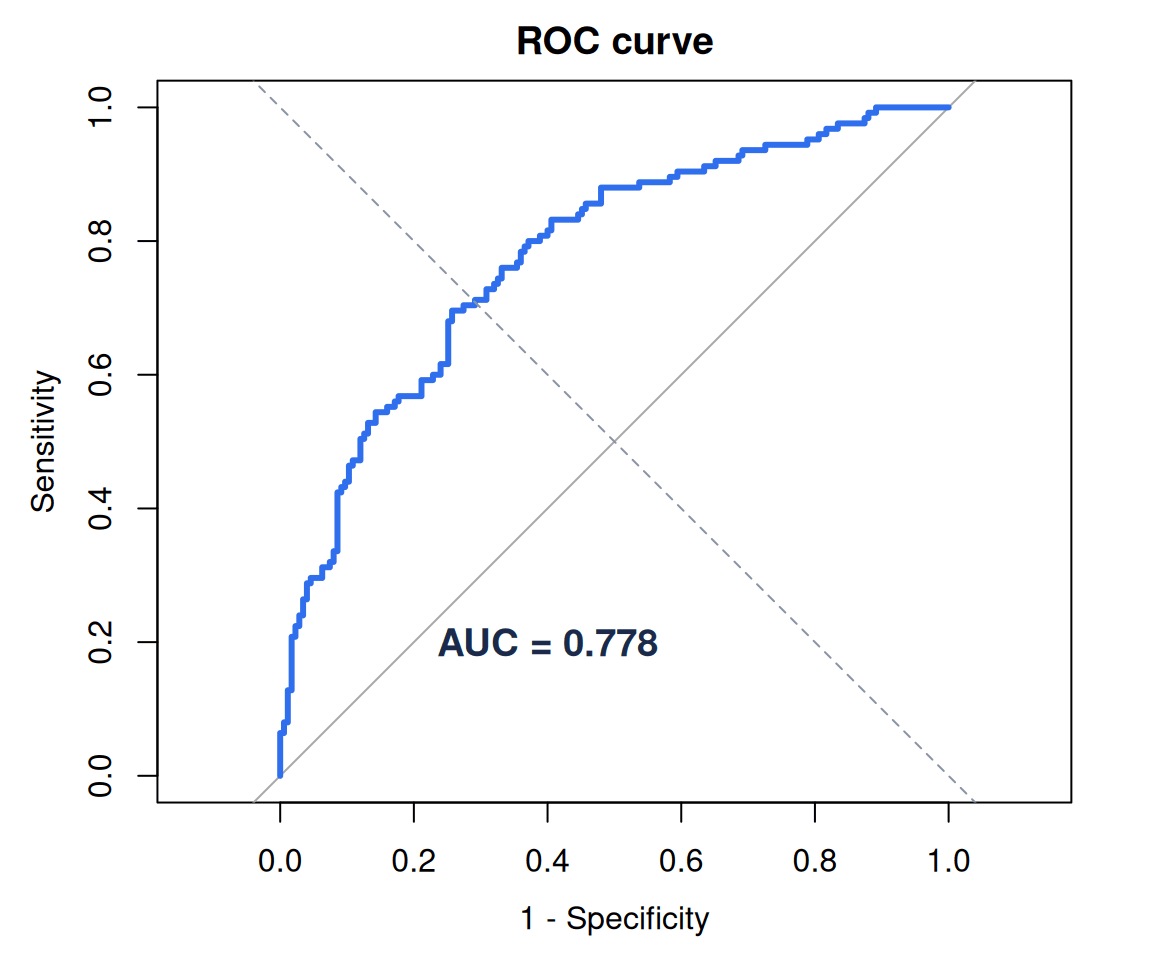
Always report the AUC with its confidence interval — a point estimate alone hides how much uncertainty there is, especially in small samples.
Finding a threshold
The curve also helps you pick an operating point. coords() returns the threshold that maximises sensitivity + specificity (the Youden index):
coords(roc_obj, "best", best.method = "youden",
       ret = c("threshold", "sensitivity", "specificity"))
threshold sensitivity specificity
1 0.441764 0.696 0.7428571A caveat worth remembering
AUC measures discrimination (ranking), not calibration (whether predicted probabilities are accurate). A model can rank perfectly yet be poorly calibrated. If the model will guide decisions, check calibration too — and remember that at low prevalence, a great AUC can still mean a modest positive predictive value.
Building or validating a clinical prediction model? That’s our clinical work.