Rverse Analytics
  • Home
  • Services
    • Services overview
    • Clinical R toolkit
    • Industries
    • Case studies
    • FAQ
  • Tools
    • All calculators
    • Sample size & power
    • p-value calculator
    • Confidence interval
    • Descriptive statistics
    • Correlation
    • Which test should I use?
    • Live demos
  • Blog
  • Resources
  • R News
  • About
  • Contact

Rverse Analytics

R consulting studio for statistical analysis, Shiny applications and reproducible reporting — biostatistics-grade rigour, shipped as code you own.

Boutique R Studio

Data analysis, engineered in R.

We deliver statistical analysis, interactive Shiny applications and fully reproducible reports — built on a rigorous biostatistics backbone and shipped as code you own.

Explore our services Get in touch

What we do

Analysis, applications and automation

Statistical Analysis

From study design to publication-ready results: hypothesis testing, regression modelling and power analysis, all scripted and reproducible.

Shiny Applications

Interactive dashboards and internal tools that turn static spreadsheets into living decision-support systems.

Reproducible Reporting

Automated Quarto and R Markdown pipelines: one command from raw data to polished Word, PDF or HTML deliverables.

See all five services

Why us

Rigour you can rerun

R-native, end to end. The analysis, the figures and the report come from one scripted pipeline — no translating between tools.

Reproducible by default. Every deliverable regenerates from raw data with a single command, so results always match the numbers.

Biostatistics backbone. Methodology forged in clinical research, and code you own outright after handover.

Explore the industries we serve, browse case studies, or read the frequently asked questions.

Free tools

Statistics calculators, free to use

No sign-up, nothing uploaded — fast browser-based calculators built on the same engine we use in client work, verified against R.

Sample size & power

How many participants do you need? Exact noncentral-t, matched to R.

Which test should I use?

Answer a few questions, get the right test and the R function to run it.

Correlation calculator

Pearson r, r², significance and a scatter plot from paired data.

See all free calculators

Our stack

One coherent ecosystem

R logo tidyverse ggplot2 Shiny Quarto lme4 · survival

The R logo is © The R Foundation, used under CC-BY-SA 4.0.

R, live on this page

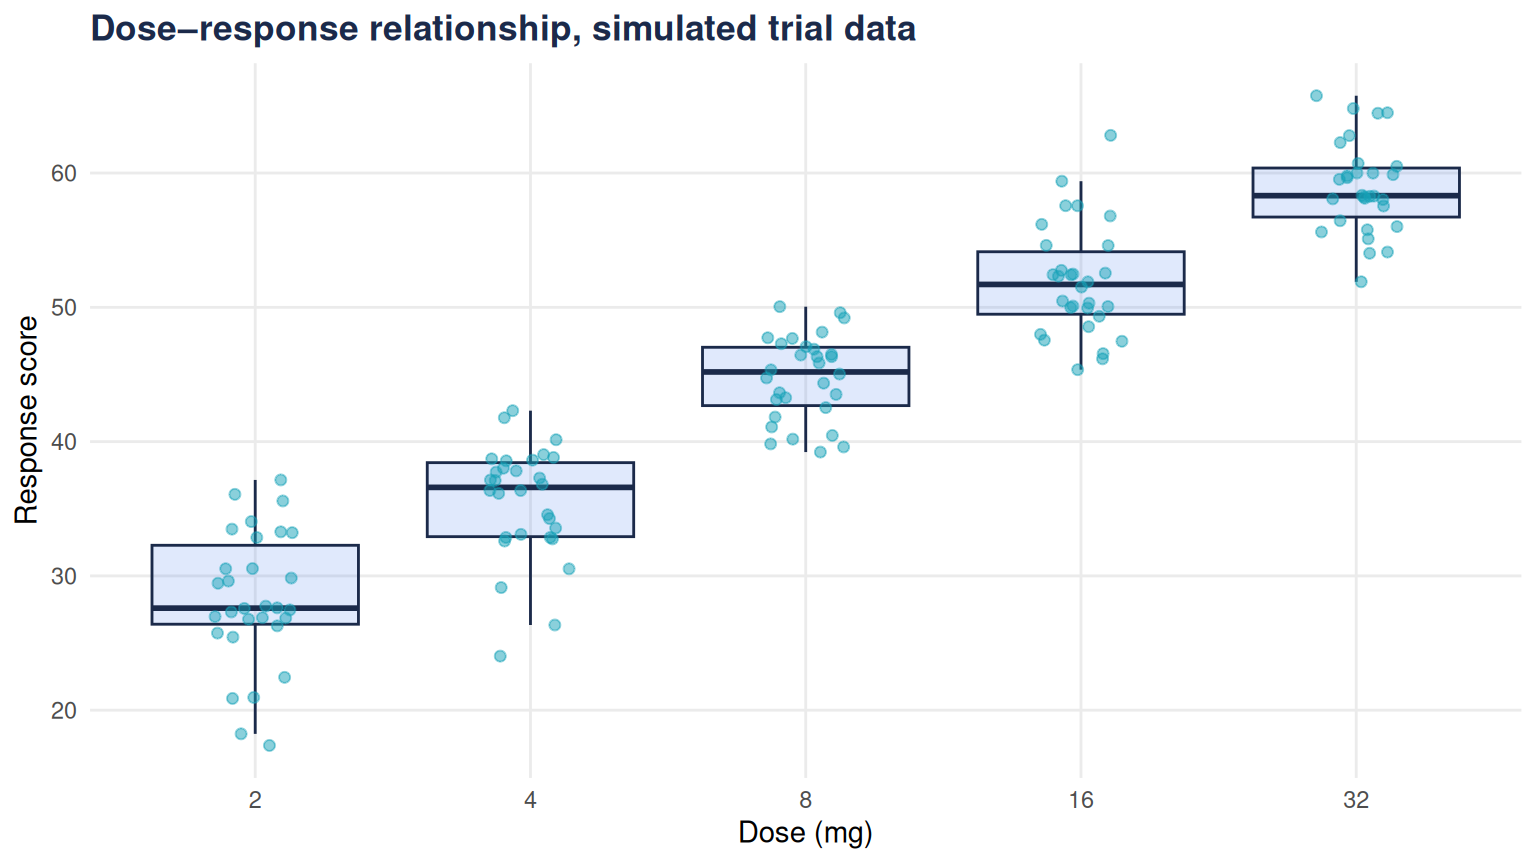
Every figure on this site is rendered by R at build time — no screenshots, no stock images. Here is the code and its output:

library(ggplot2)

set.seed(42)
d <- data.frame(
  dose     = rep(c(2, 4, 8, 16, 32), each = 30),
  response = unlist(lapply(c(2, 4, 8, 16, 32),
                           function(x) rnorm(30, 20 + 8 * log2(x), 4)))
)

ggplot(d, aes(factor(dose), response)) +
  geom_boxplot(fill = "#2f6fed", alpha = 0.15, colour = "#1b2a4a",
               outlier.shape = NA) +
  geom_jitter(width = 0.15, alpha = 0.5, colour = "#17a2b8", size = 1.6) +
  labs(
    title = "Dose–response relationship, simulated trial data",
    x = "Dose (mg)", y = "Response score"
  ) +
  theme_minimal(base_family = "sans") +
  theme(
    plot.title = element_text(face = "bold", colour = "#1b2a4a"),
    panel.grid.minor = element_blank()
  )

From the blog

Latest posts

Your Table 1, in one line, with gtsummary

clinical
biostatistics
gtsummary
reporting

Baseline characteristics tables are the most-copied, most-error-prone table in clinical papers. gtsummary generates a publication-ready one — with the right summary and test per variable — from a single call.

Jul 9, 2026

What to know before hiring an R consultant

consulting
reproducibility
workflow

The questions that separate a one-off script from work your team can actually own: scope, reproducibility, code ownership and handover.

Jul 8, 2026

Cohen’s d and effect size in R

statistics
effect-size
r-tutorial

Why a p-value isn’t enough, and how to compute and interpret Cohen’s d effect size in R — the standardized measure of how big a difference between two groups really is.

Jul 7, 2026
No matching items

All posts

© 2026 Rverse Analytics — a boutique R studio.

R consulting · statistics · Shiny · reproducible reporting

Built with Quarto & R.