Interactive Demo Gallery
Every demo below runs entirely in your browser — real R and Shiny compiled to WebAssembly, no install and no server. Click a tile to launch it. The first load fetches the R runtime, so give it a few seconds.
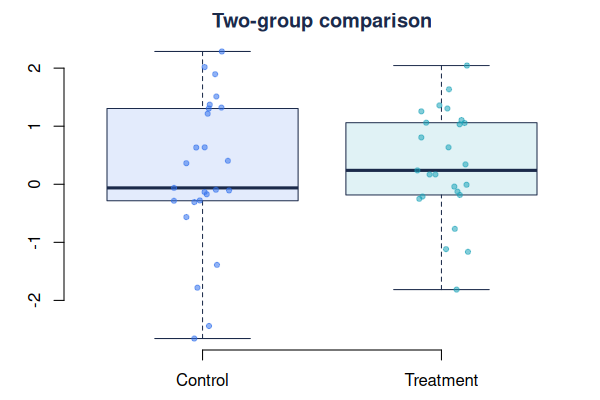
Two-group comparison
Move the sliders and watch a t-test react to sample size and effect size.
Launch →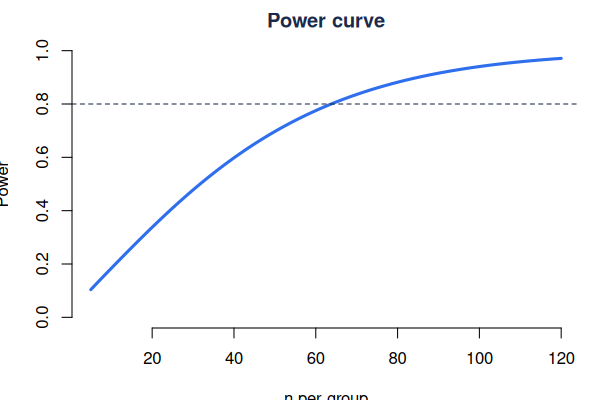
Power curve explorer
How many participants do you need? See power rise with sample size.
Launch →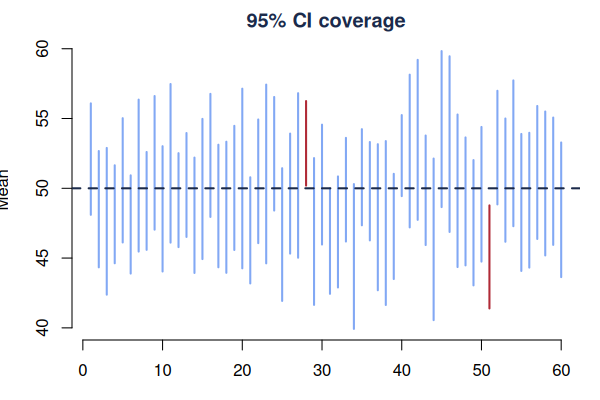
What 95% confidence means
100 intervals from 100 fresh samples — watch how many miss the true mean.
Launch →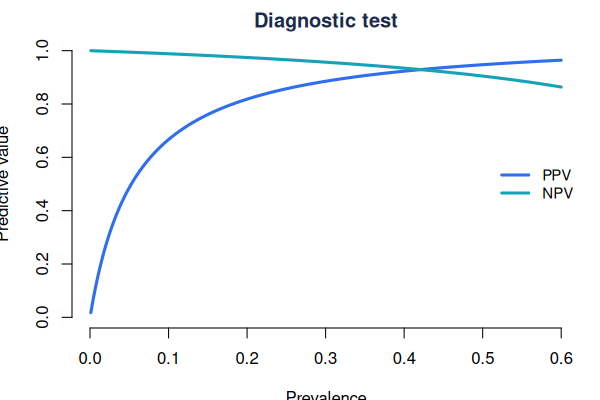
Diagnostic test explorer
See how predictive values swing with disease prevalence.
Launch →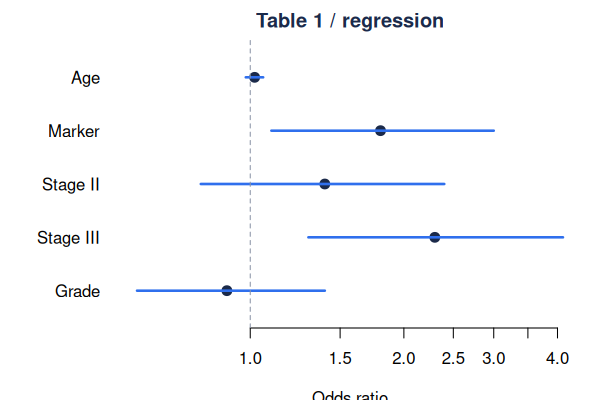
Table 1 explorer
Build a clinical baseline table with no code — pick variables, get the table.
Launch →
gtsummary live demo
Edit real gtsummary R code and run it on clinical trial data.
Launch →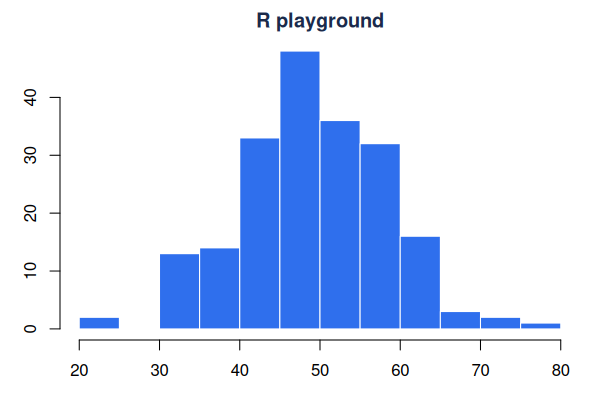
R playground
Run any R code in the browser — plus real biostatistics datasets to explore.
Launch →Keep going
Learn interactively
Prefer a guided path? These free courses run R live on every page:
### Learn R Vectors, data frames, plotting and your first statistics — run each step.
### Learn Quarto Reproducible reports that mix text, R code and results.
### Learn Markdown Master Markdown syntax with a live editor on every page.
These demos are the same technology we use for client dashboards — minus the server. Want one wired to your own data? That’s our Shiny practice.