Cox proportional hazards in R — and the assumption you must check
clinical
biostatistics
survival
A hazard ratio is only meaningful if the proportional-hazards assumption holds. Fit a Cox model, report hazard ratios, then test the assumption with cox.zph() — the step too many analyses skip.
Author
Rverse Analytics
Published
June 30, 2026
Cox proportional hazards regression is the standard tool for time-to-event outcomes with covariates — survival adjusted for age, treatment, stage. It’s easy to fit and easy to misuse, because its central assumption is easy to forget: hazard ratios are assumed constant over time. If that fails, your single hazard ratio is an average of a moving target.
Fit the model
We’ll use the trial dataset (ttdeath = time, death = event) and adjust for treatment, age and grade:
library(survival)library(gtsummary)cx <-coxph(Surv(ttdeath, death) ~ trt + age + grade, data = trial)tbl_regression(cx, exponentiate =TRUE) |>bold_p() |>modify_caption("**Hazard ratios for death**")
Hazard ratios for death
Characteristic
HR
95% CI
p-value
Chemotherapy Treatment
Drug A
—
—
Drug B
1.30
0.88, 1.92
0.2
Age
1.01
0.99, 1.02
0.3
Grade
I
—
—
II
1.21
0.73, 1.99
0.5
III
1.79
1.12, 2.86
0.014
Abbreviations: CI = Confidence Interval, HR = Hazard Ratio
A hazard ratio above 1 means a higher instantaneous risk; below 1, lower. exponentiate = TRUE converts the model’s log-hazard coefficients into the hazard ratios you actually report.
Now check proportional hazards
This is the step that separates a defensible analysis from a fragile one. cox.zph() tests whether each effect is stable over time:
zph <-cox.zph(cx)zph
       chisq df    p
trt    2.053  1 0.15
age    0.163  1 0.69
grade  4.365  2 0.11
GLOBAL 6.666  4 0.15
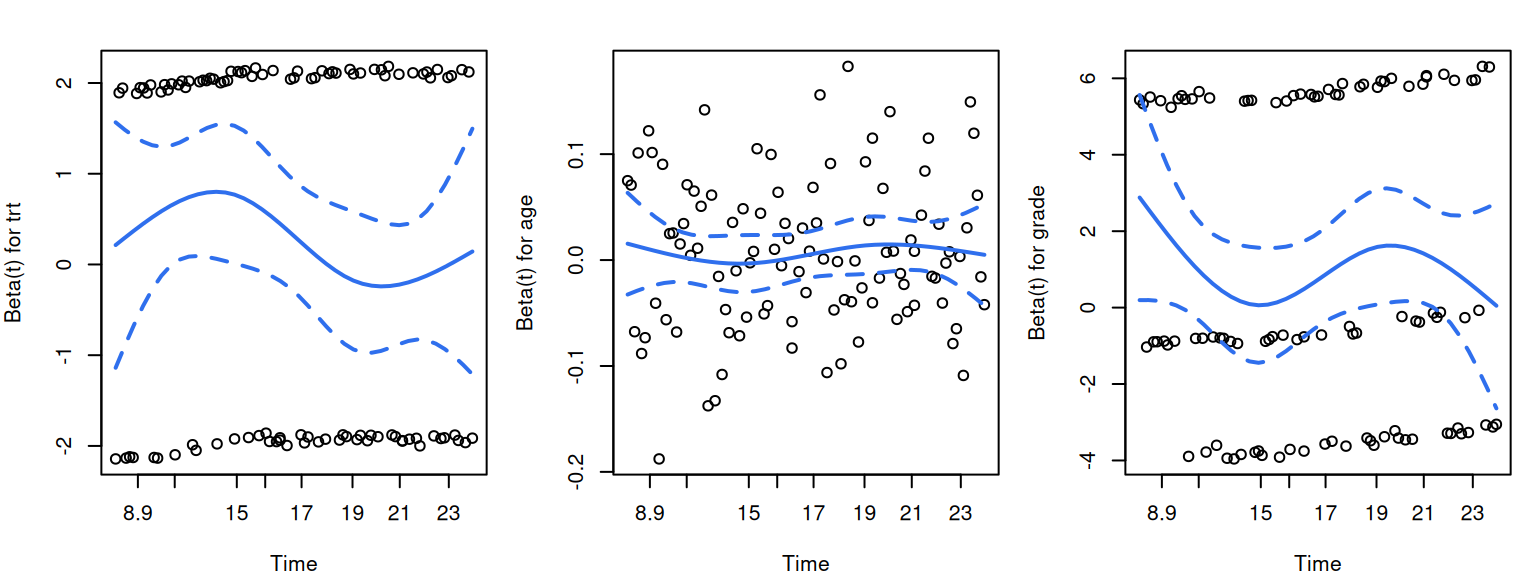
Large p-values (and a non-significant GLOBAL row) mean the proportional-hazards assumption is reasonable. Back it up visually — the scaled Schoenfeld residuals should scatter flat around zero, with no trend:
par(mfrow =c(1, 3), mar =c(4, 4, 2, 1), family ="sans")plot(zph, col ="#2f6fed", lwd =2)
Figure 1
When the assumption fails
A significant test isn’t the end of the world — it’s a signpost. The usual responses: stratify on the offending variable, fit a time-varying coefficient, split follow-up into time intervals, or switch to an accelerated failure-time model. What you should never do is report the hazard ratio as if the assumption held when it didn’t.
The takeaway
Fitting the Cox model is one line; earning the right to interpret it is the second line, cox.zph(). Report both, and your reviewers have one fewer thing to worry about.