How to Install R and RStudio (2026): Step-by-Step with Screenshots
- Two installs, in this order: R first (the language, from CRAN), then RStudio (the editor, from Posit). Both are free and take about ten minutes together.
- You only ever type into RStudio. R itself has no interface you need to open; RStudio finds it automatically.
- Your first session fits in five commands: arithmetic, a variable, a vector,
summary()on a built-in dataset andhist()for a plot. - Packages are add-ons installed once with
install.packages()and loaded in every session withlibrary(). The “there is no package called …” error simply means the install step was skipped. - Done installing? Continue with the free R Foundations course or the interactive Learn R lessons that run in your browser.
R is the language. RStudio is the program you write it in. New users often install only one of the two, or install them in the wrong order, and then see a blank window or a “R not found” message. This guide installs both, in the right order, and ends with a short session so you can confirm everything works.
The screenshots come from a fresh session of R 4.6.1 and RStudio 2026.09. Button labels on your machine may differ slightly by version, but the steps have been stable for years.
Step 1: Download R from CRAN
R is distributed by CRAN, the Comprehensive R Archive Network. Open cran.r-project.org and pick your operating system from the first box.
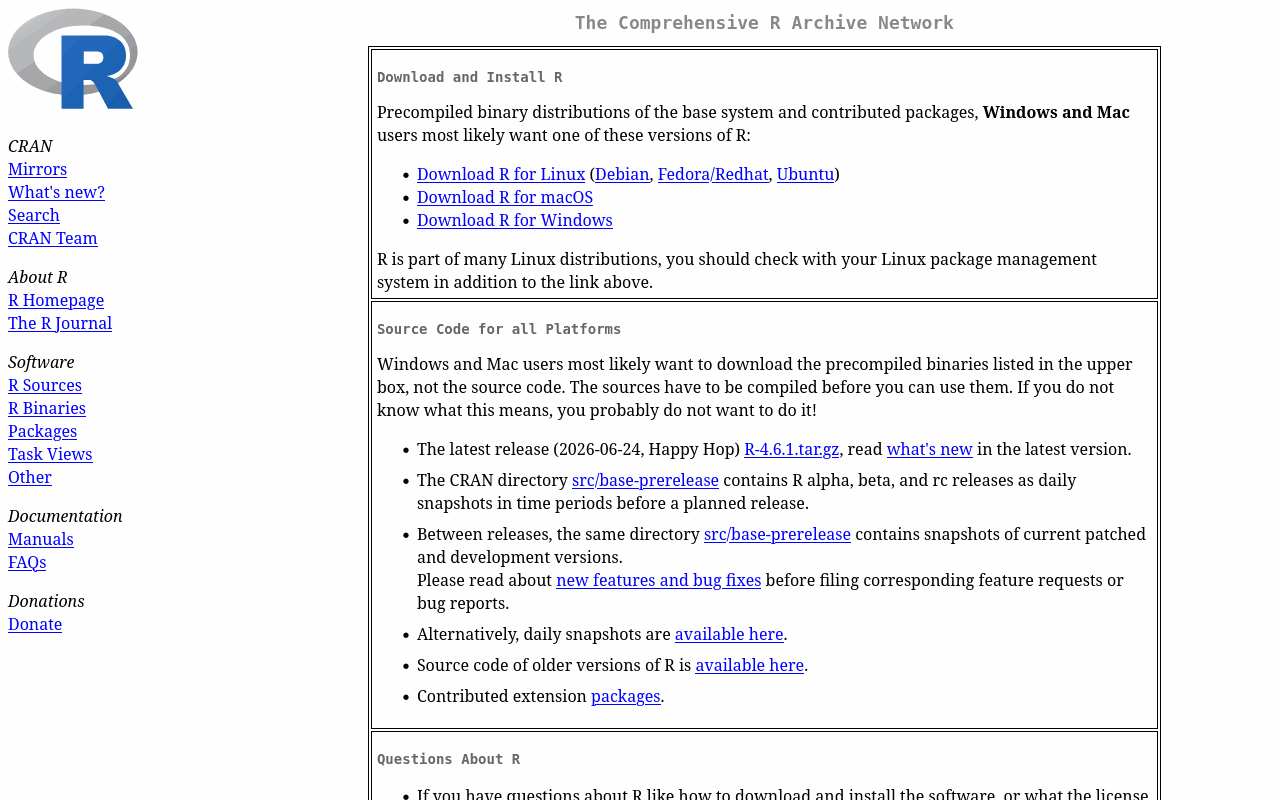
Windows
Click Download R for Windows, then base, then the large Download R-4.x.x for Windows link at the top of the page. The file is about 90 MB.
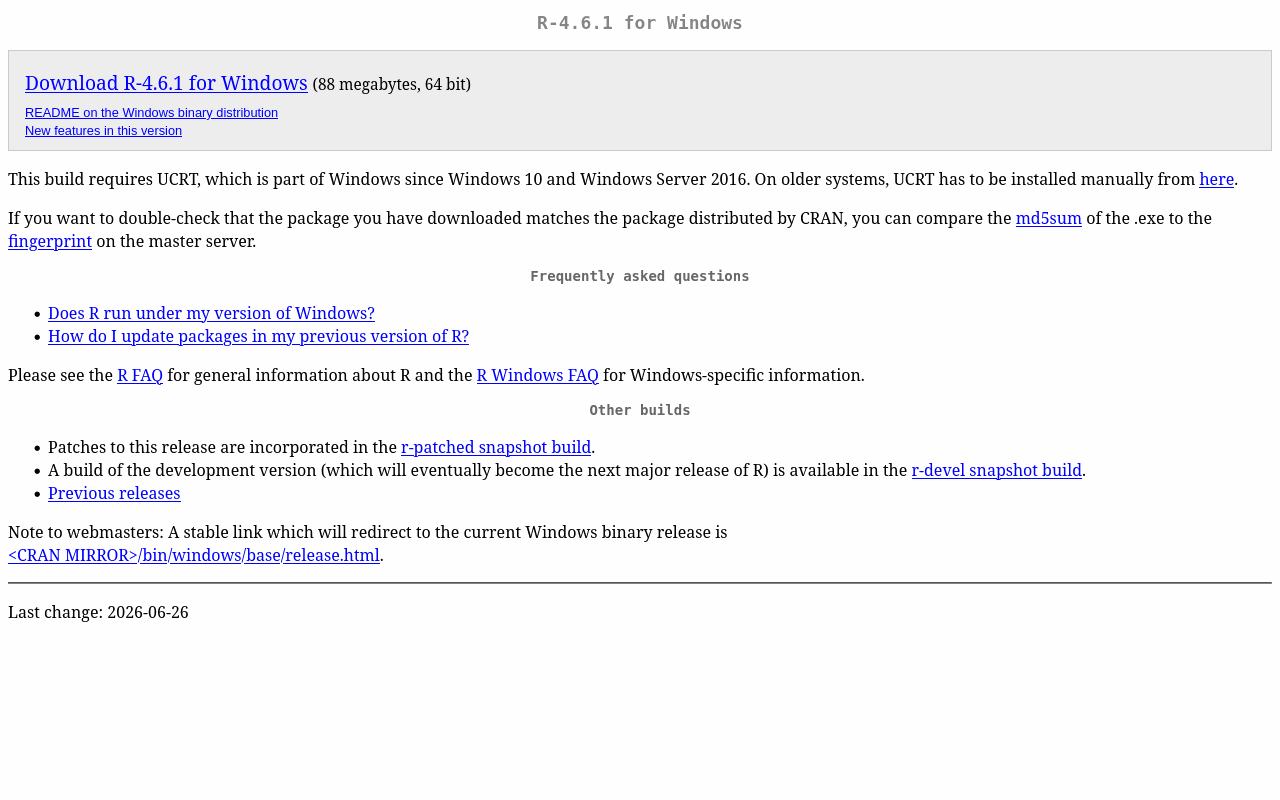
Run the downloaded .exe. Accept every default in the installer: destination folder, components (64-bit), start menu folder. There is no need to change anything.
macOS
Click Download R for macOS. The page offers two installers: one for Apple silicon (M1, M2, M3, M4 chips) and one for older Intel Macs. If you are not sure which Mac you have, open the Apple menu and choose About This Mac; the Chip line tells you.
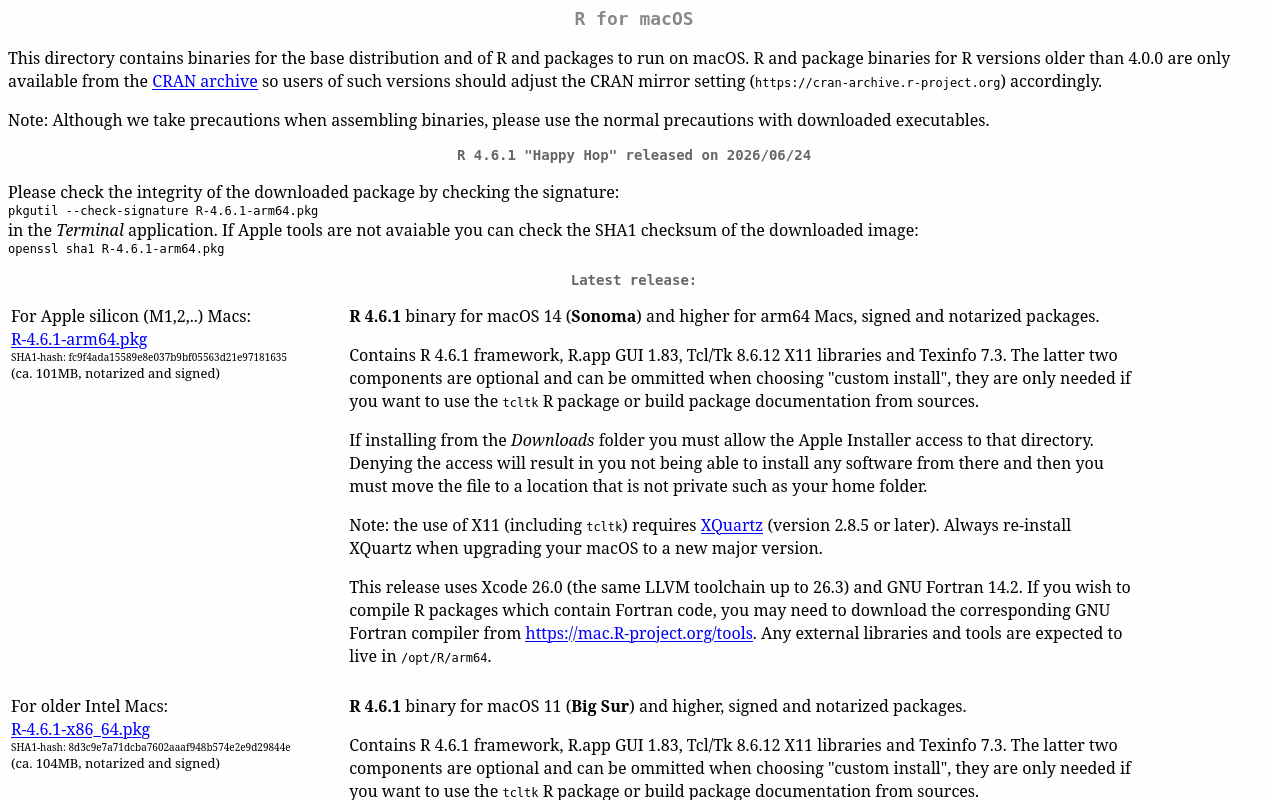
Open the .pkg file and click through the installer. If macOS refuses to open it because it was downloaded from the internet, right-click the file and choose Open.
Linux
On Ubuntu and Debian the quickest route is the system package manager:
sudo apt update
sudo apt install r-base r-base-dev
This gives you the R version in your distribution’s repository, which may be a few releases behind CRAN. For the current release, follow the Ubuntu-specific instructions linked from the CRAN Linux page, which add CRAN’s own repository first.
Step 2: Download RStudio from Posit
RStudio is made by Posit and lives at posit.co/downloads. Click Download RStudio and then the installer for your operating system. The page detects your system and offers the right file first.
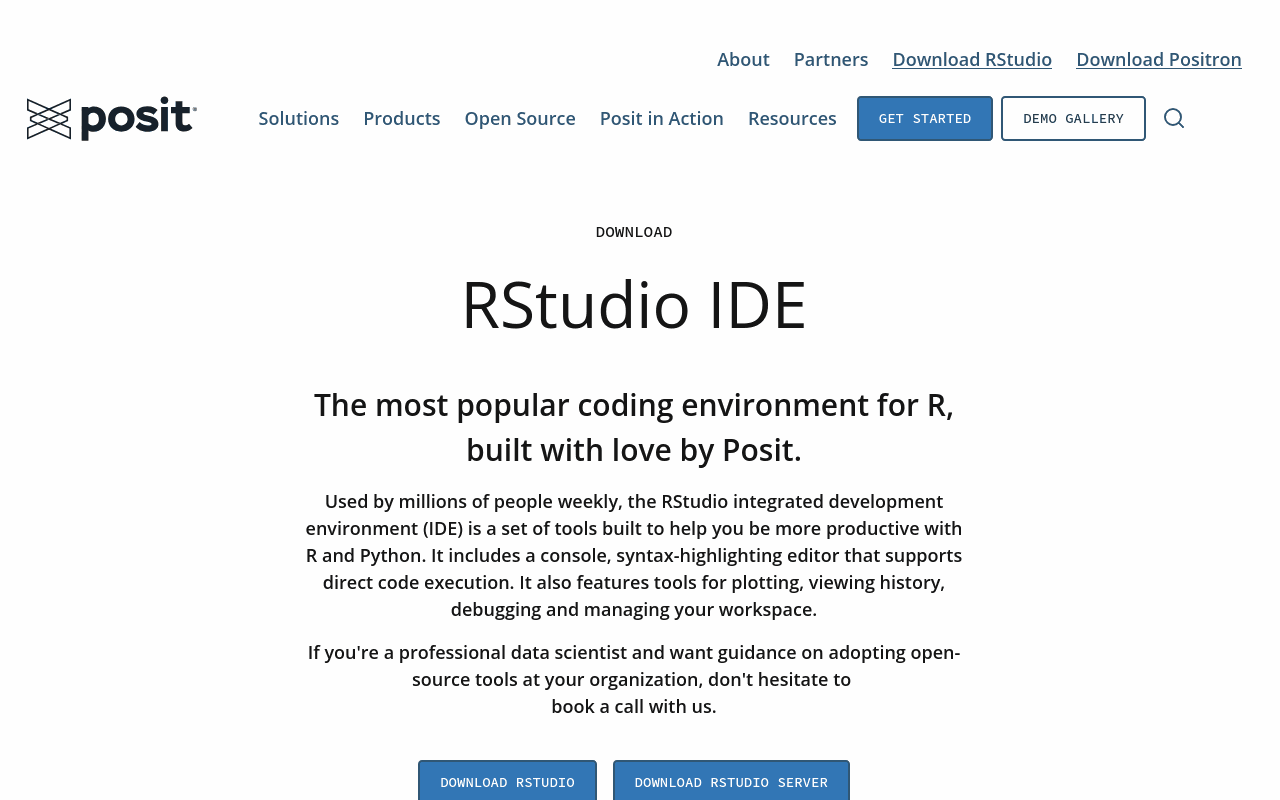
- Windows: run the
.exeand accept the defaults. - macOS: open the
.dmgand drag RStudio into Applications. - Linux: install the
.debor.rpmwith your package manager, for examplesudo apt install ./rstudio-*.deb.
RStudio looks for R in the standard location, so because you installed R first it will find it without any configuration.
Step 3: Open RStudio and check that R responds
Start RStudio. You will see three or four panes. The one that matters today is the Console on the left, where you type R commands and see their results immediately.
Type the following line into the console and press Enter after it:
R.version.string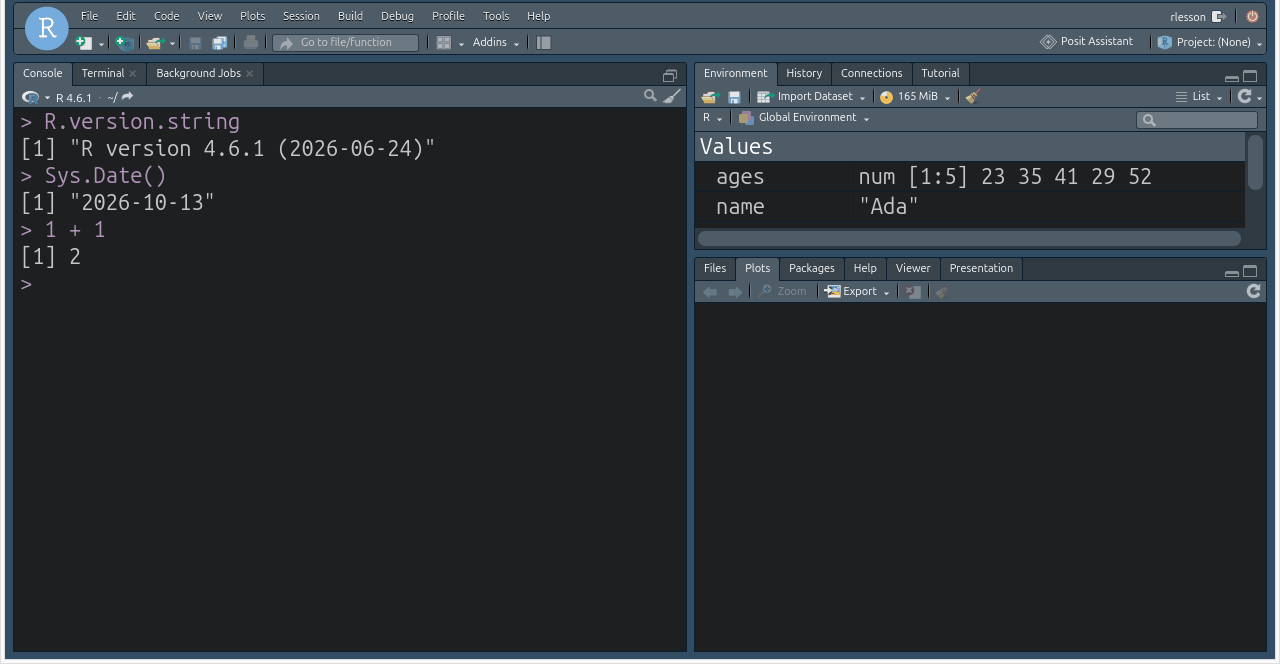
If you see a version string like "R version 4.6.1 (2026-06-24)", both installs worked. The other panes:
- Environment (top right) lists every object you create. It is empty now and will fill up in a minute.
- Files / Plots / Packages / Help (bottom right) shows your files, your plots, installed packages and documentation.
- The Source pane (top left, hidden until you open a file) is where you write scripts you want to keep. The console is for trying things out.
Step 4: Your first R session
Type each block into the console. The screenshots show what you should see.
R as a calculator
2 + 3
10 / 4
sqrt(16)
2^10
7 %% 3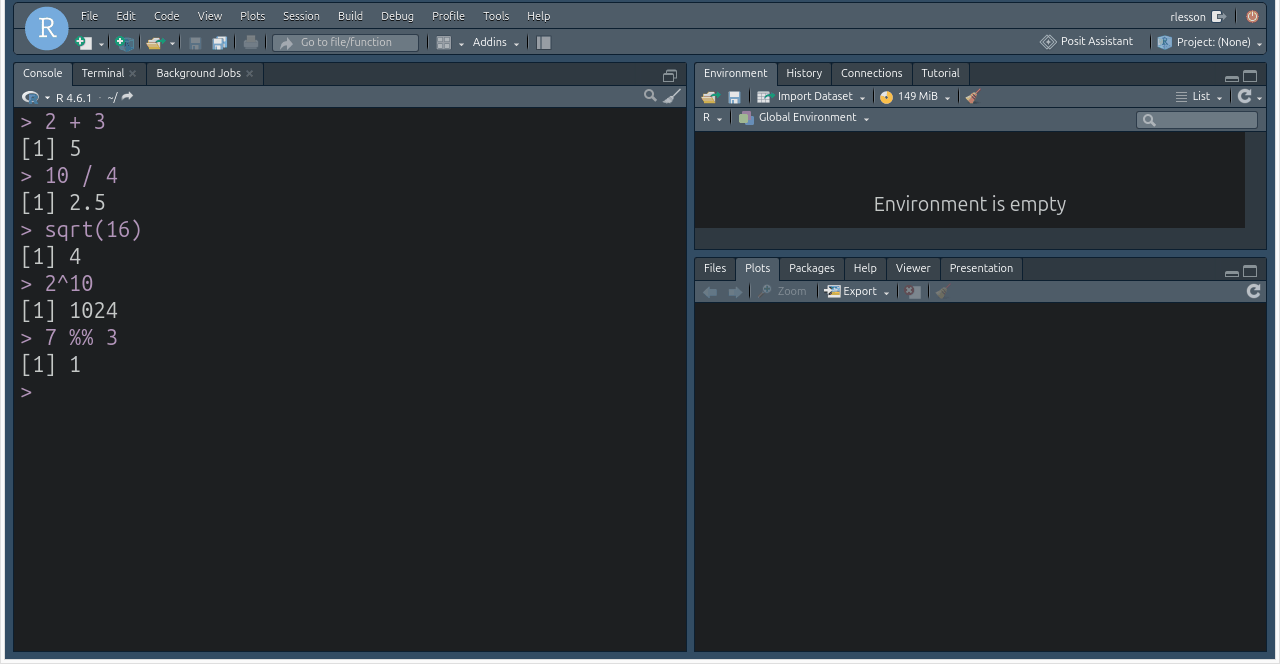
%% is the remainder operator: 7 divided by 3 leaves 1.The [1] in front of each answer is R telling you this is the first element of the result. It matters once results have more than one value.
Variables
The arrow <- stores a value under a name. Type it as a less-than sign followed by a minus sign, or press Alt+Minus in RStudio.
x <- 5
y <- 10
x + y
name <- "Ada"
paste("Hello,", name)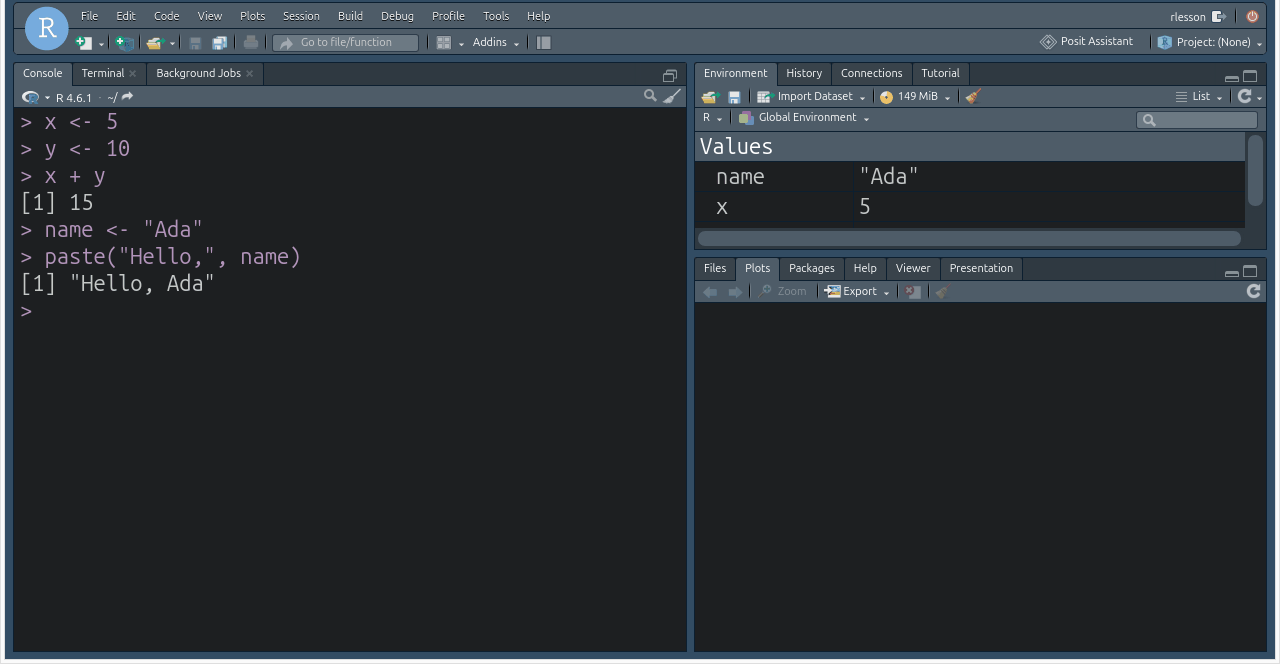
x, y and name now appear in the Environment pane on the right.Text goes in quotes; numbers do not. paste() glues pieces of text together with a space.
Vectors
A vector is several values of the same kind in one object. Most of R works on whole vectors at once, which is why you rarely need loops.
ages <- c(23, 35, 41, 29, 52)
length(ages)
mean(ages)
ages[ages > 30]
sort(ages, decreasing = TRUE)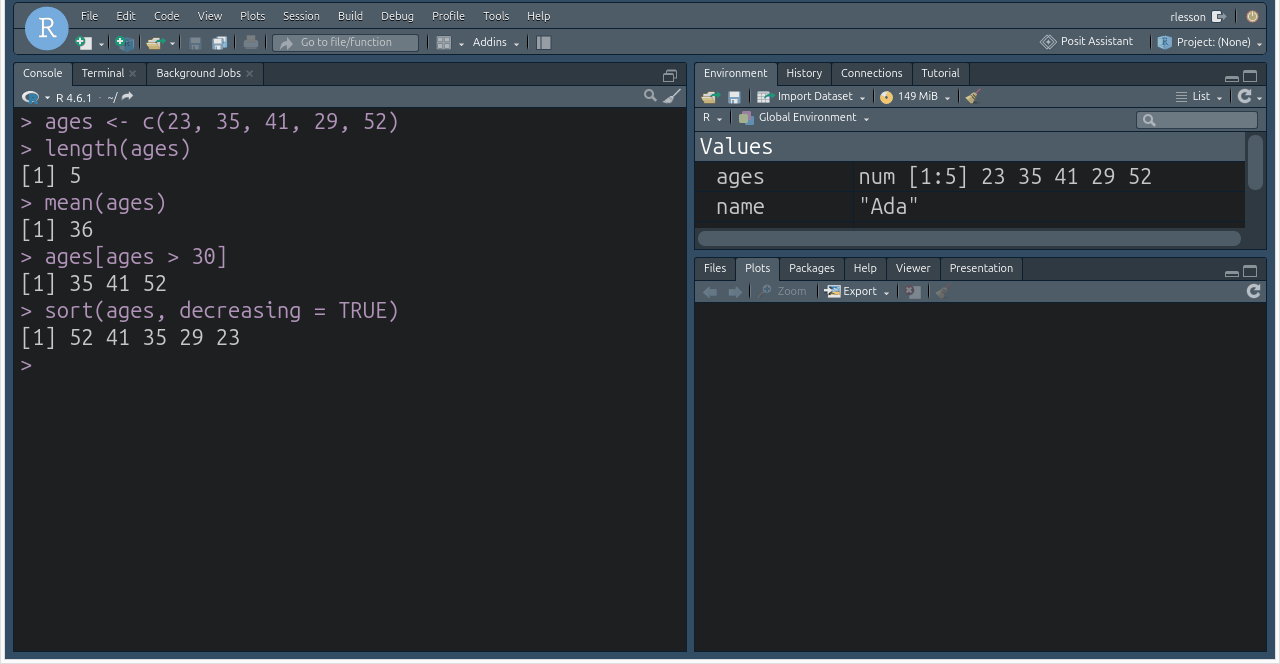
ages[ages > 30] keeps only the elements where the condition is true.c() stands for combine. The square brackets select elements, and the condition inside them can be anything that gives TRUE or FALSE for each element.
A built-in data frame
R ships with practice datasets. mtcars holds 32 cars with 11 measurements each. A data frame is R’s table: rows are observations, columns are variables.
head(mtcars[, 1:4], 4)
summary(mtcars$mpg)
table(mtcars$cyl)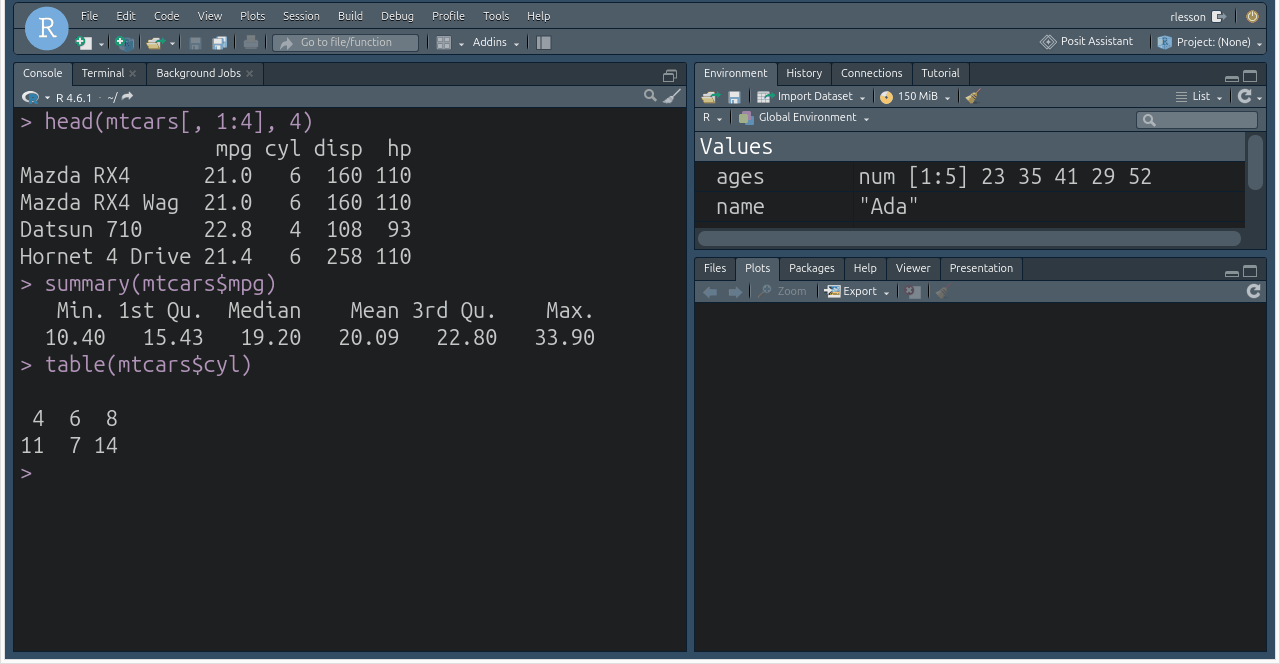
head() shows the first rows, summary() gives the five-number summary and mean of one column, table() counts categories.The dollar sign picks one column: mtcars$mpg is the miles-per-gallon column. table() counts how many cars have 4, 6 or 8 cylinders.
Your first plot
hist(mtcars$mpg, col = "steelblue", border = "white",
     main = "Fuel economy of 32 cars", xlab = "Miles per gallon")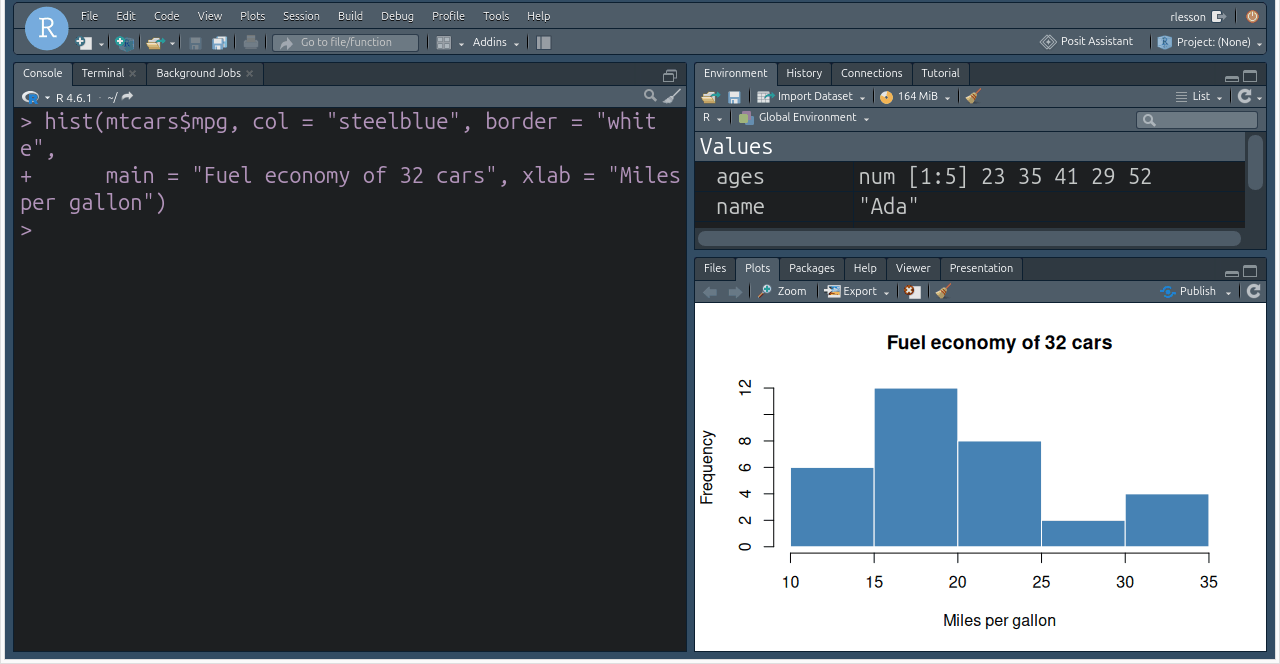
+ on the second console line means R was waiting for the rest of the command.Plots go to the Plots pane. The Export button there saves the image as PNG or PDF. Note the + prompt on the second line: R saw that the first line ended mid-command and waited for the closing parenthesis. If you ever get stuck at a + prompt, press Escape.
Step 5: Install your first package
Base R is complete for the basics. Most real work also uses packages, add-ons written by the community and distributed through CRAN. Installing one is a single command. Here is what happens if you try to load a package you have not installed yet:
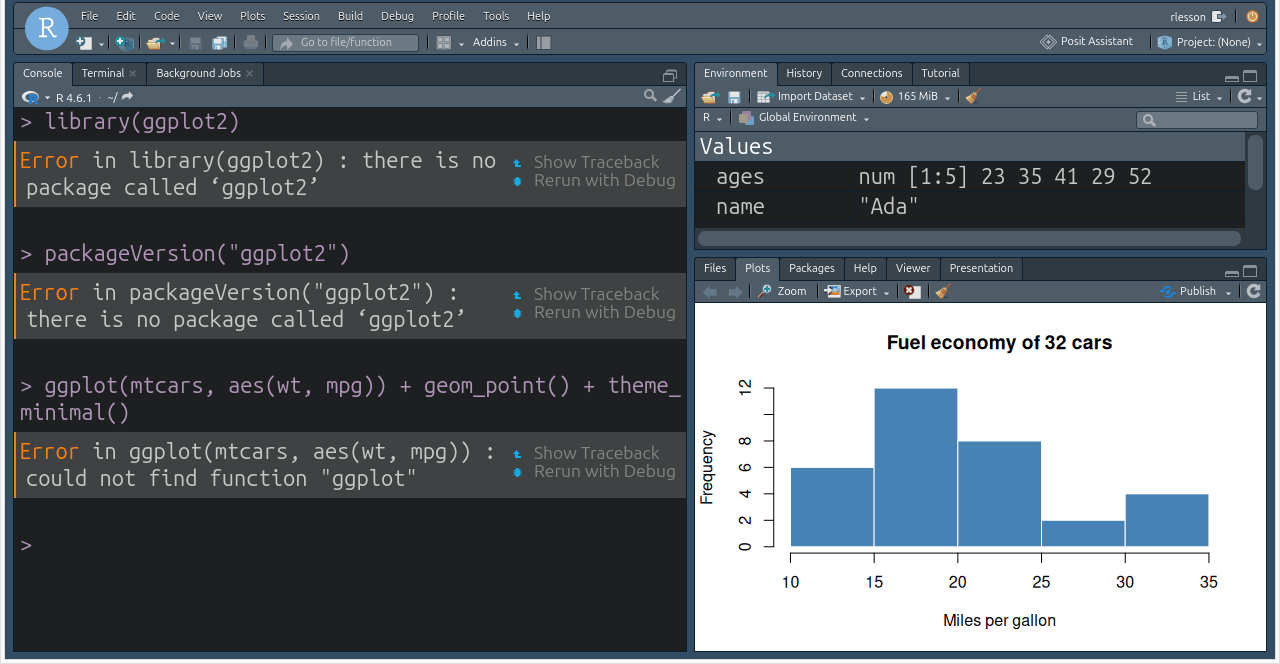
The fix is install.packages(). The example below uses praise, a tiny package that installs in seconds; the command is the same for ggplot2, dplyr or any other CRAN package.
install.packages("praise")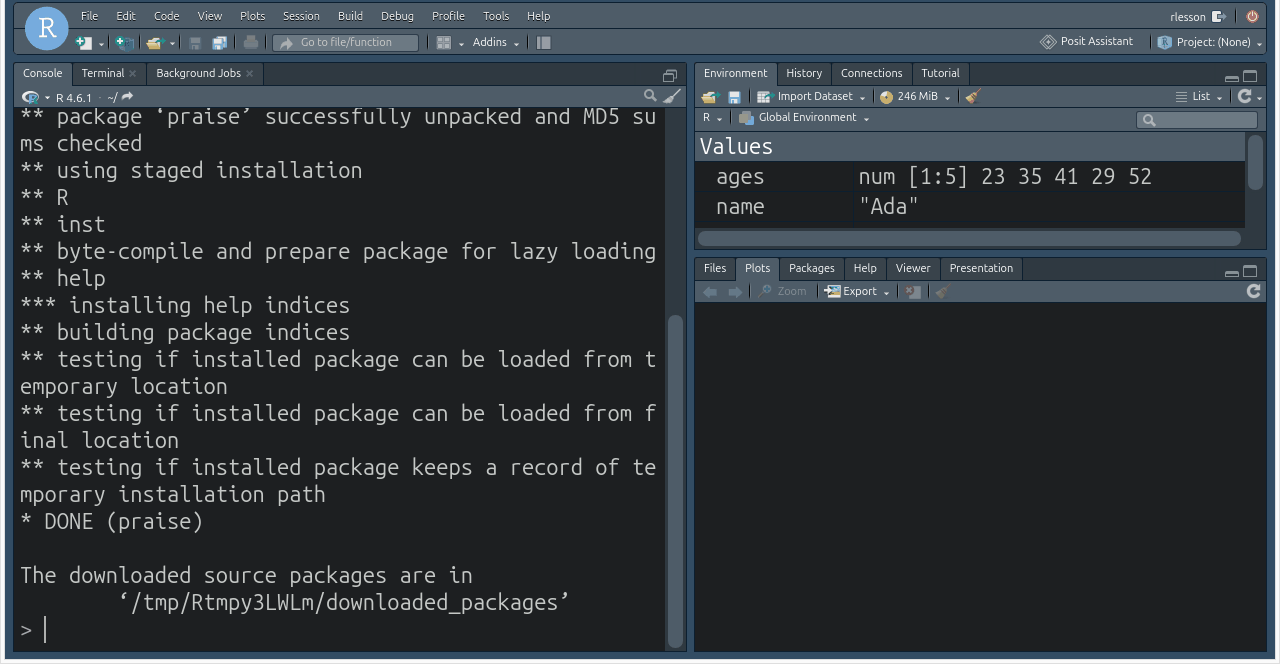
install.packages() downloads the package from CRAN and installs it. The last lines say DONE (praise).Installing is done once per computer. Loading is done once per session with library():
library(praise)
praise()
praise("You just installed your first R package. ${EXCLAMATION}!")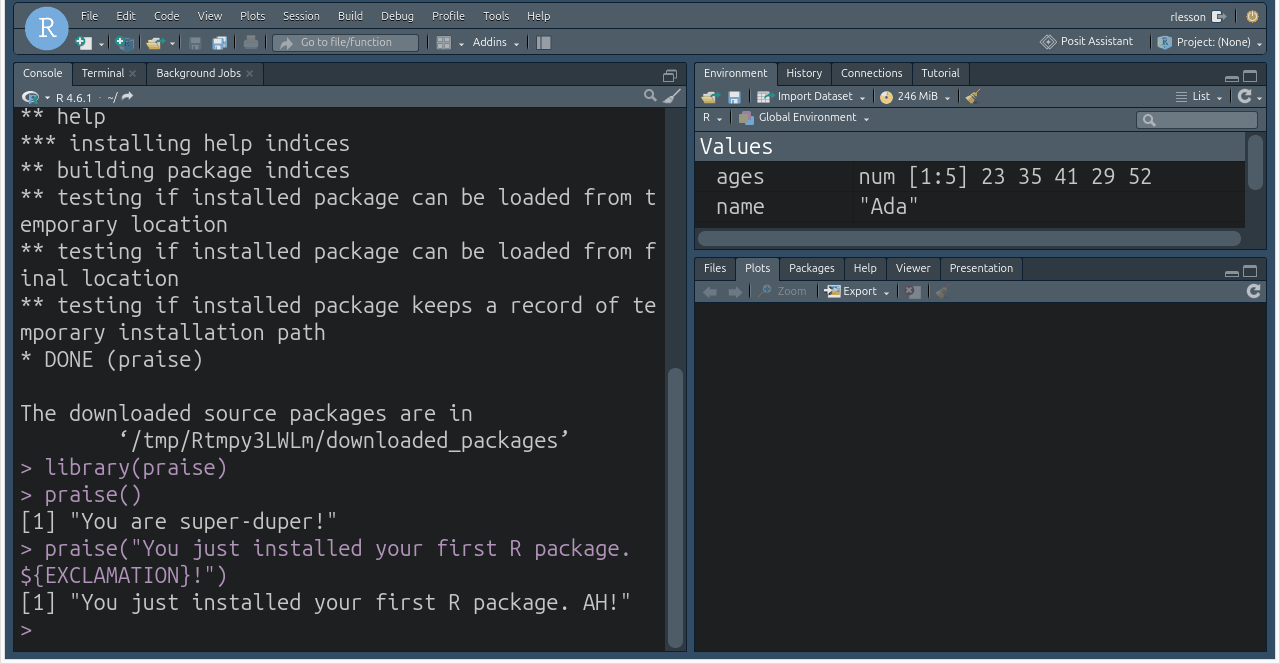
library() makes its functions available for the rest of the session.Two things trip people up here:
- Quotes.
install.packages("praise")needs quotes;library(praise)works with or without them. - Windows personal library. The first
install.packages()on Windows may ask whether to create a personal library in your user folder. Answer Yes.
Common problems
RStudio opens but the console says R could not be found. R was not installed, or RStudio started before the R installer finished. Install R from CRAN, restart RStudio.
install.packages() fails with “cannot open URL” or “unable to access index”. Your network blocks CRAN, usually a corporate proxy. Try again on another network, or ask IT to allow cloud.r-project.org.
On macOS, “package is damaged and can’t be opened”. Gatekeeper blocked the download. Right-click the installer and choose Open, or allow it under System Settings → Privacy & Security.
Everything is tiny or huge. In RStudio, Tools → Global Options → Appearance sets the editor font size and theme. The screenshots here use a dark theme and a large font; the default is a light theme.
I closed RStudio and my variables are gone. That is expected. Anything you want to keep belongs in a script: File → New File → R Script, then run lines with Ctrl+Enter (Cmd+Return on macOS).
Where to go next
You now have a working R installation and have run arithmetic, variables, vectors, a data frame, a plot and a package. The next step is practising those same ideas on real data:
- R Foundations: a free 20-lesson video course that starts exactly where this guide ends.
- Learn R in your browser: the same material as interactive lessons, no installation needed, handy on a machine where you cannot install software.
- R biostatistics cheat sheets: one-page PDF references for when you forget a function name.
- R Biostatistics Datasets: the built-in clinical datasets to practise on once
mtcarsgets boring.
If you are setting up R for a team, a clinical programming group or a SAS-to-R migration rather than for yourself, see regulatory-grade R for version-pinned environments and validation documentation, and the R package qualification with riskmetric guide for choosing packages.